Recently I implemented Zabbix monitoring system on Linux servers, some of which are physical machines, and some are LXC containers under those physical machines. In order to get accurate data on the CPU and RAM of the container, I used the wonderful Zabbix template for LXC/LXD containers (here the template: https://github.com/scanterog/zabbix-lxd). I used this template since it is known that the CPU and RAM data in the container, which received by regular methods do not correspond to reality (they show data of the host system).
Everything was fine, we can see of CPU and memory usage of container. But I was asked to show the memory on the graph in relation to the total volume of the container’s memory, because, by default, the maximum on the axis Y is set to “calculate” and looks like this:

But we needed to put total container RAM size along the Y axis.
The solution could be quite simple, but it is not provided in the template. There are many ways to do that. I used the following: in the /sys virtual directory on the host system there is a lot of useful kernel information. For example, the data from the file /sys/fs/cgroup/memory/lxc/{container ID}/memory.limit_in_bytes. So all you need to do is create an item prototype and change the display of the graph.
Go to the control panel Zabbix, then Configuration->Templates, in the list of templates we are searching for our Template LXD and clicking on its Discovery section:
![]()

There is a single discovery rule. There just click on its “Item prototypes” subsection and then click the “Create Item Prototype” button.

We are interesting in:
Name: Total memory {#HCONTAINERID}
Key: lxd.mem [/ {# HCONTAINERID}, hierarchical_memory_limit]
Units: B
Application: LXD
The rest can be left by default or you can change it according to your need. Then click “Add”.
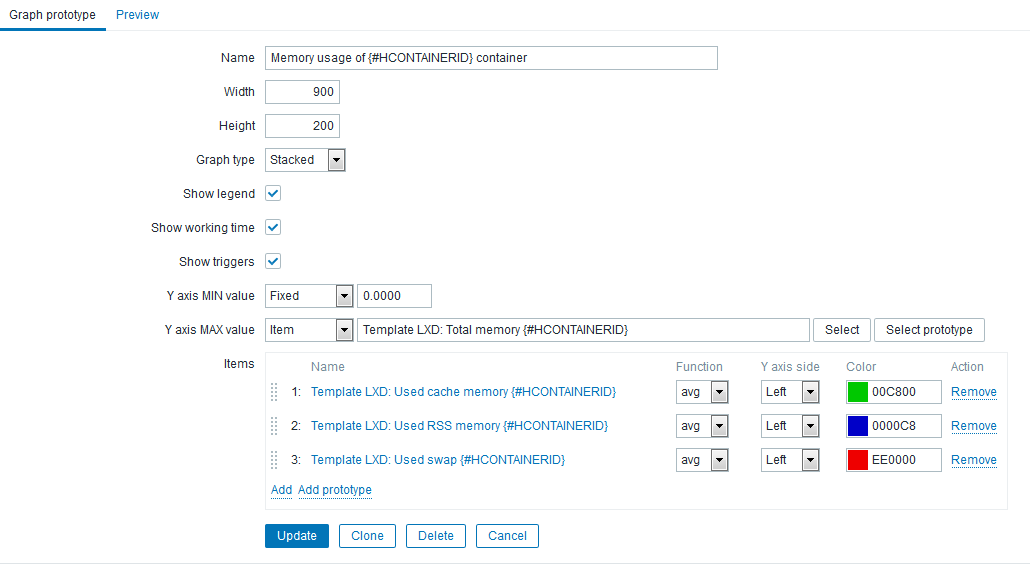
Next we need to go back to our discovery rule and select the “Graphs Prototypes” subsection, where we will click on our the “Memory usage of {#HCONTAINERID} container”.
In this graph prototype in the setting of the maximum Y-axis value select “Item” from the drop-down list and then specify “Total memory {#HCONTAINERID}” item prototype we created before.
That’s it. Now look at the dashboard, changes are shown in our graph, now the Y axis shows the amount of memory of the container, 8GB in my case.
